NovaAI Compute
Choosing an ai inference server manufacturer in 2026 requires more than comparing processor names and advertised throughput. The right partner must prove performance under realistic workloads, including large language models, computer vision, and retrieval systems. A reliable evaluation should examine latency, tokens per second, memory capacity, cooling requirements, power consumption, and software compatibility. Numbers without test conditions can mislead.
Andrew Ng, a respected AI researcher and industry leader, said, “AI is the new electricity.” His observation remains useful because inference now supports daily business operations, not occasional experiments. A capable manufacturer should therefore provide stable hardware, optimized drivers, monitoring tools, security updates, and responsive technical support. Ask for customer references. Request benchmark details. Inspect the warranty terms.
Experience also matters. A server may perform well in a laboratory, then struggle inside a crowded data center. Rack density, network design, thermal limits, and maintenance access can change the result. Small details matter. Fan noise matters. Power spikes matter. Replacement time matters.
No shortlist is perfect. That is worth admitting. Vendor claims may sound precise, while real workloads remain unpredictable. Buyers should test representative models with their own data, software stack, and concurrency targets. They should also review the manufacturer’s financial stability, supply-chain visibility, compliance practices, and upgrade roadmap. The cheapest system may become expensive after support delays, inefficient energy use, or forced replacement. A thoughtful decision balances measurable speed with operational trust. That balance defines a dependable ai inference server manufacturer.
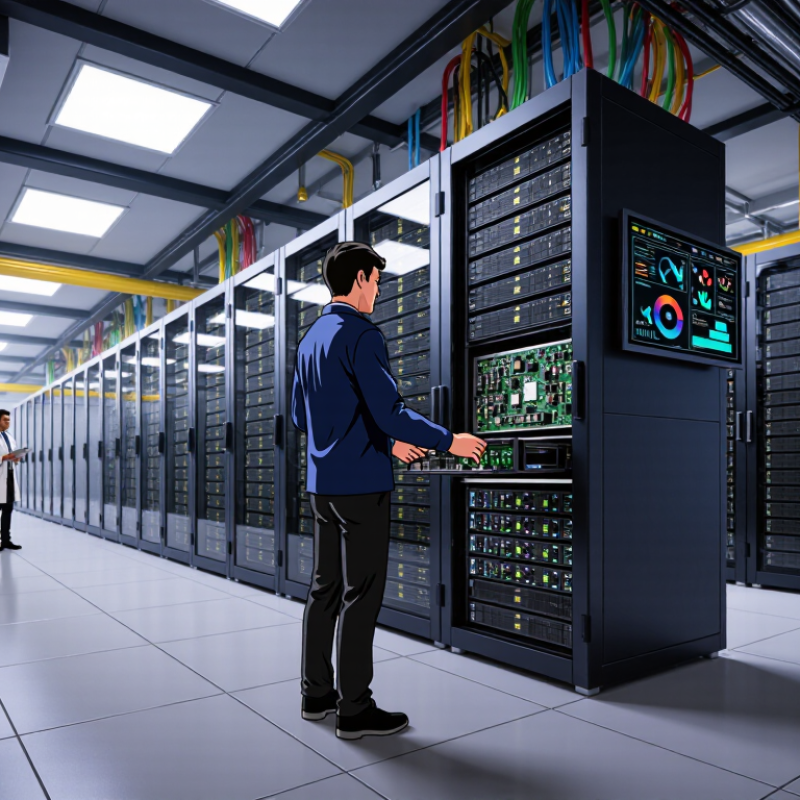
When comparing an AI inference server manufacturer in 2026, inspect more than processor speed. A capable manufacturer should provide validated hardware, optimized inference software, remote management, firmware updates, and clear warranty terms. It should also explain performance under real workloads, including language models, vision systems, and retrieval applications. Thermal design matters. Rack-level airflow, power distribution, and noise limits affect daily operations. The International Energy Agency’s Electricity 2024 report projects data center electricity use could exceed 1,000 terawatt-hours by 2026. Therefore, efficiency is not a marketing detail. It is an operating cost.
A reliable manufacturer should support deployment beyond the sales contract. Ask about installation, model conversion, security patches, spare parts, and technician response times. Stanford University’s AI Index Report 2025 found that the cost of querying a system with GPT-3.5-level performance fell more than 280-fold between late 2022 and late 2024. Lower inference costs can change purchasing decisions, but server utilization still determines value. No benchmark answers every workload. That limitation matters. A perfect chart may hide weak performance during peak traffic.
Tips: Request measured tokens per second, latency at 50%, 90%, and 99% utilization, and power per million tokens. Require a test using your own model and data format. Check whether support covers software updates, not only hardware failures. Ask for a three-year operating-cost estimate. Be skeptical of perfect results. You should be.
AI inference server manufacturers typically integrate accelerators, high-bandwidth memory, host memory, networking, storage, power delivery, thermal management, firmware, and lifecycle support. This vendor-neutral comparison uses theoretical peak bandwidth values for widely adopted interface and memory standards; actual system performance depends on hardware configuration, workload, software, and utilization.
Sources: PCI-SIG PCIe 5.0 specification; IEEE 802.3bs 400 GbE; JEDEC HBM3E standard; JEDEC DDR5 SDRAM standard; PCI-SIG NVMe over PCIe performance characteristics. Values shown are approximate theoretical maxima in decimal GB/s.
Start with the workload, not the server cabinet. Record model size, input length, output length, daily requests, peak requests, and acceptable latency. A customer-support model may need 150 milliseconds per response. A video-analysis system may tolerate several seconds. These are different infrastructure problems.
Measure tokens per second and time to first token separately. Also define concurrency during promotions, outages, and overnight batch processing. The Stanford AI Index 2025 reports that GPT-3.5-level inference costs fell from about $20 to $0.07 per million tokens between November 2022 and October 2024. Lower prices can encourage careless demand forecasts. I would challenge any estimate based only on average traffic.
Power and cooling belong in the requirement document. The International Energy Agency estimates that data centers used about 415 terawatt-hours of electricity in 2024. It projects demand could reach roughly 945 terawatt-hours by 2030. Ask manufacturers for performance per watt, thermal design limits, rack density, and measured results under your model’s actual precision. Published peak figures are useful, but incomplete. Request reproducible tests with your prompts, batch sizes, and software stack.
Define availability realistically. A retail assistant may require rapid failover, while an internal search tool may accept brief maintenance. Specify support response times, spare-part access, firmware practices, and upgrade paths. Do not select the highest accelerator count automatically. It may increase cost, heat, and operational risk without improving user experience.
Choosing an AI inference server manufacturer in 2026 requires more than comparing accelerator counts. Hardware should match your workload, not merely advertise peak performance. Check memory capacity, bandwidth, thermal limits, networking, and upgrade paths. A model may run quickly in a laboratory, then slow down under concurrent requests.
Software deserves equal scrutiny. Test driver stability, framework compatibility, quantization support, monitoring, and container deployment. Ask for reproducible results using your model, batch size, and latency target. MLPerf Inference results can provide a useful reference, but they are not a substitute for production testing. Stanford’s AI Index 2025 reported that GPT-3.5-level inference costs fell more than 280-fold between November 2022 and October 2024. Lower prices change expectations, but they do not remove integration risks.
Tips: Request a workload-specific pilot. Measure time to first token, tokens per second, p95 latency, utilization, power draw, and failure recovery. Compare three operating scenarios: quiet hours, normal traffic, and sudden demand. The IEA’s Energy and AI report estimates data-center electricity use could exceed 945 TWh by 2030. Efficiency is therefore a performance metric, not just an environmental preference. No scorecard is perfect. A vendor’s benchmark may look impressive while hiding software tuning or inconvenient test conditions. Treat documentation as evidence, not proof, and verify every important claim on your own infrastructure.
| Evaluation Area | Dimension | What to Verify | Recommended Target or Reference Value | Required Evidence | Why It Matters |
|---|---|---|---|---|---|
| Hardware | Accelerator memory capacity | Available high-bandwidth memory or graphics memory after system reservation, including support for model weights, runtime buffers, and the KV cache. | At least 80 GB for many large-model deployments; use approximately 140 GB or more for a 70-billion-parameter model in BF16 before adding runtime overhead. | Memory-capacity specification, supported model list, and a successful full-load test at the intended context length. | Insufficient memory causes model sharding, offloading, lower throughput, or deployment failure. |
| Hardware | Memory bandwidth | Published accelerator memory bandwidth and measured bandwidth during decode-heavy inference. | Prefer the highest available bandwidth for autoregressive workloads; require measured utilization and not only theoretical peak figures. | Technical specification plus a reproducible memory-bandwidth and token-generation benchmark. | Decode performance is frequently limited by moving model weights between memory and compute units. |
| Hardware | Interconnect and topology | Peer-to-peer communication, accelerator-to-accelerator bandwidth, NUMA placement, PCIe generation, and topology under multi-accelerator load. | Peer-to-peer access must be enabled; avoid configurations where traffic regularly crosses a remote CPU socket or a congested PCIe switch. | Topology diagram, peer-to-peer bandwidth test, and multi-accelerator scaling results. | Good topology reduces synchronization overhead and improves tensor- or pipeline-parallel performance. |
| Hardware | Host CPU and system memory | CPU core count, memory channels, RAM capacity, NUMA layout, and CPU-to-accelerator affinity. | Use sufficient CPU capacity for tokenization, request scheduling, networking, and preprocessing; provide at least 2–4 times the model-weight memory as host RAM for large deployments when offload or caching is required. | System configuration, NUMA-aware benchmark, and CPU utilization at peak request rate. | Host bottlenecks can reduce accelerator utilization and increase queueing latency. |
| Hardware | Storage and model loading | Local storage type, sustained read speed, encryption, model-cache behavior, and time required to load or reload a model. | Use enterprise NVMe storage with sufficient capacity for model versions, tokenizer files, and caches; measure cold-start time rather than relying on sequential-read specifications. | Cold-start test, model-loading log, storage endurance rating, and failure-recovery procedure. | Fast loading shortens maintenance windows and improves recovery after host or process failures. |
| Hardware | Power, cooling, and density | Real server power draw, thermal throttling, rack power requirements, airflow direction, and performance per watt. | Report idle, average, and peak power at a fixed workload; require no thermal throttling during a sustained 30–60 minute test. | Power-meter readings, thermal logs, fan profile, rack requirements, and sustained-load results. | Electricity and cooling costs directly affect total cost of ownership and deployment density. |
| Software | Model-format compatibility | Support for common open model formats, safe tensor loading, tokenizer variants, custom operators, and model-specific configuration. | The proposed stack must load the exact production model without manual binary modification or unsupported custom patches. | End-to-end deployment demonstration using the intended model, tokenizer, quantization, and context length. | Compatibility problems often appear only after procurement and can delay production deployment. |
| Software | Precision and quantization | BF16, FP16, FP8, INT8, and lower-bit support, including calibration method and accuracy impact. | Compare at least one high-precision baseline with the proposed quantized format; define an application-specific accuracy-loss limit before testing. | Accuracy report on a representative validation set and throughput results for every supported precision. | Quantization can lower memory use and improve throughput, but quality loss must be measured rather than assumed. |
| Software | Batching and scheduling | Continuous batching, dynamic batching, priority queues, prefill/decode separation, request cancellation, and admission control. | Support continuous batching and bounded queues; verify behavior under mixed prompt lengths and concurrent users. | Load-test configuration, queue metrics, cancellation test, and latency distribution under mixed traffic. | Scheduling determines whether high throughput can be achieved without unacceptable user latency. |
| Software | Context length and KV-cache management | Maximum supported context, paged or segmented KV cache, prefix caching, eviction policy, and memory fragmentation. | Test the production context length and a mixture of short and long requests; report cache hit rate and out-of-memory behavior. | Long-context stress test, cache statistics, and failure behavior at the configured concurrency limit. | KV-cache growth can become the main memory constraint during concurrent generation. |
| Software | API and integration | Open API compatibility, streaming responses, authentication, rate limiting, retries, timeouts, and observability hooks. | Provide documented REST or gRPC interfaces, streaming support, backward-compatible versioning, and clear error codes. | API specification, integration test, security review, and sample client implementation. | Stable interfaces reduce application changes and simplify migration between infrastructure providers. |
| Software | Container and orchestration support | Container images, device plug-ins, health checks, rolling upgrades, autoscaling, and compatibility with the target cluster platform. | Support reproducible container deployment and health-based scheduling without requiring privileged manual host changes. | Deployment manifest, upgrade test, node-drain test, and documented host dependencies. | Operational consistency is essential when scaling from one server to a fleet. |
| Performance | Time to first token | Latency from request acceptance to the first generated token, separated into queue, preprocessing, and model-prefill time. | Set a service-level objective based on the application; report median, p95, and p99 instead of only an average. | Benchmark with fixed prompt lengths, concurrency levels, precision, and context settings. | First-token latency strongly influences perceived responsiveness in interactive applications. |
| Performance | Inter-token latency | Time between generated tokens during the decode phase, measured after the first token. | Define a maximum p95 value for the user experience; keep the result stable when concurrency increases within the planned operating range. | Streaming trace with p50, p95, and p99 inter-token latency under sustained load. | Stable token pacing is more useful to users than a high short-term peak rate. |
| Performance | Output throughput | Generated tokens per second per server and per accelerator, measured with realistic prompt lengths and concurrency. | Report both aggregate output tokens per second and tokens per request; do not compare results produced with different sampling or context settings. | Reproducible benchmark script, model checksum, prompt set, concurrency, precision, and software versions. | Throughput indicates capacity, but aggregate results can hide poor individual-request performance. |
| Performance | Request throughput and saturation | Completed requests per second, queue depth, accelerator utilization, and the point at which latency exceeds the service objective. | Operate below the saturation knee with reserve capacity; a practical starting point is 20–30% headroom for traffic bursts. | Load curve showing throughput, latency, queue depth, and utilization as concurrency rises. | Operating too close to saturation causes unstable latency and cascading queues. |
| Performance | Accuracy and output quality | Task accuracy, exact-match or ranking metrics, safety behavior, structured-output validity, and regression results after quantization. | Use a fixed, representative evaluation set and agree on pass/fail thresholds before selecting hardware. | Versioned evaluation dataset, scoring method, baseline comparison, and error analysis. | The fastest server is unsuitable if its optimized model fails the application’s quality requirements. |
| Reliability | Availability and fault recovery | Hardware redundancy, process restart, node replacement, checkpoint or model-cache recovery, and failure isolation. | Define measurable recovery-time and recovery-point objectives; test accelerator, host, network, and process failures separately. | Fault-injection report, recovery timeline, alert definitions, and spare-parts plan. | Recovery behavior determines whether a single fault becomes a service outage. |
| Operations | Monitoring and observability | Metrics for latency, tokens, queue depth, errors, memory, temperature, power, utilization, and per-model usage. | Expose machine-readable metrics and distributed traces with request identifiers while protecting prompt and response data. | Dashboard examples, metric dictionary, alert rules, and data-retention policy. | Without detailed telemetry, performance regressions and capacity issues are difficult to diagnose. |
| Security | Supply-chain and data protection | Firmware provenance, signed images, vulnerability response, secure boot options, encryption, access control, and log redaction. | Require documented patch timelines, least-privilege access, encrypted management traffic, and no uncontrolled retention of prompts or outputs. | Security questionnaire, software bill of materials, vulnerability policy, and penetration-test summary. | Inference servers process sensitive model weights and potentially confidential user data. |
| Commercial | Total cost of ownership | Purchase price, support, power, cooling, software licensing, networking, storage, maintenance, and expected utilization. | Calculate cost per million generated tokens and cost per successfully completed request at the planned utilization level. | Five-year cost model using measured power, support terms, utilization assumptions, and replacement costs. | Unit price alone does not reveal the economic value of an inference platform. |
| Commercial | Support and lifecycle | Support response time, spare-part availability, firmware lifecycle, software update policy, and migration assistance. | Obtain written service-level commitments and a defined lifecycle plan covering the expected production period. | Support agreement, escalation matrix, release calendar, warranty terms, and reference deployment evidence without relying on brand claims. | Long-term maintainability is as important as initial benchmark performance. |
Reliability should be tested beyond a product sheet. Ask for sustained workload results, not only peak performance figures. Run a 48-hour inference test with realistic models, batch sizes, and thermal conditions. Watch for throttling, memory errors, and unexpected restarts. Review power redundancy, cooling design, component traceability, and failure-recovery procedures. A manufacturer should provide field failure data, even when the numbers are uncomfortable. Perfect records are unlikely.
Security needs evidence, not reassuring language. Check for secure boot, signed firmware, hardware-based key protection, and strict administrative access. Request a documented patch process and clear vulnerability response targets. Logs should record configuration changes, failed logins, and software updates. Confirm how returned servers are wiped or destroyed. Ask whether independent security testing has been completed. “Compliant” alone proves very little.
Support quality becomes visible during a midnight outage. Compare guaranteed response times, escalation paths, spare-part availability, and local service coverage. Ask who handles difficult cases: a trained engineer or a general help desk. Test support before purchasing with detailed technical questions. Their answers reveal practical knowledge quickly. Also examine the support period, firmware lifecycle, and replacement policy. A low purchase price can become expensive when one unavailable power module stops production. Vendor documentation may look polished, yet maintenance instructions can still be incomplete. That deserves careful questioning.
Choosing an AI inference server manufacturer in 2026 requires more than comparing purchase prices. Calculate total cost of ownership across five years. Include electricity, cooling, software licenses, maintenance, and technician time. A low-cost server may consume more power under sustained workloads. That difference becomes visible on monthly utility bills.
Scalability should match realistic demand, not optimistic forecasts. Request benchmark data using your expected model size, batch volume, latency target, and daily traffic pattern. Ask whether memory, storage, and accelerator capacity can be expanded without replacing the whole system. Check network bandwidth carefully. A powerful processor cannot compensate for a slow data path. Short tests are useful. They are not enough.
Long-term value depends on support quality and technical continuity. Review warranty response times, spare-part availability, firmware updates, security practices, and compatibility with future software frameworks. In practical evaluations, unclear service terms often create higher costs than hardware failures. A spreadsheet can still mislead. It may ignore staff training, migration work, or downtime during upgrades. Leave room for uncertain growth, but avoid paying for capacity that sits idle. A useful contract should define measurable performance, transparent maintenance fees, and a clear upgrade path. Ask difficult questions before installation, when negotiation remains possible.
Record model size, input length, output length, daily requests, peak requests, and latency targets. A customer-support tool may need 150 milliseconds. A video system may tolerate several seconds. Start with workload details, not cabinet size.
Measure time to first token and tokens per second separately. Also test p95 latency, concurrency, utilization, and failure recovery. Run quiet-hour, normal-traffic, and sudden-demand scenarios. Average traffic can mislead.
Request a workload-specific pilot using your prompts, batch sizes, model precision, and software stack. Measure results on your own infrastructure. A benchmark may hide special tuning or favorable conditions. Treat documentation as evidence, not proof.
Check memory capacity, memory bandwidth, networking, thermal limits, and upgrade paths. A fast processor cannot fix a slow data path. Inspect sustained performance under concurrent requests. Peak figures are incomplete.
Sustained inference can create substantial electricity and cooling demands. Ask for performance per watt, thermal design limits, rack density, and measured power draw. A lower purchase price may produce higher monthly utility bills. Heat matters daily.
Test driver stability, framework compatibility, quantization support, monitoring, and container deployment. Confirm that updates will not interrupt production workloads. Ask about security practices and future framework compatibility. Software problems are easy to underestimate.
Estimate total ownership costs across five years. Include electricity, cooling, licenses, maintenance, technician time, training, migration, and downtime. Do not compare purchase prices alone. My spreadsheet may still be wrong.
Ask whether memory, storage, and accelerator capacity can expand without replacing the whole system. Review warranty response times, spare-part access, firmware updates, and upgrade procedures. Define measurable performance and maintenance fees in the contract. Leave room for growth, but avoid idle capacity.
Choosing the right ai inference server manufacturer in 2026 requires more than comparing processor specifications. A qualified manufacturer should provide integrated hardware, optimized inference software, deployment guidance, lifecycle management, and responsive technical support. Start by defining your workload requirements, including model size, expected request volume, latency targets, energy limits, storage needs, and future expansion plans. These factors will help determine the appropriate accelerator configuration, memory capacity, networking design, and software compatibility.
When evaluating suppliers, examine real-world performance, system stability, security controls, monitoring tools, and update policies rather than relying only on advertised benchmarks. Reliability should include component quality, thermal management, backup options, and service response times. Cost analysis should cover the complete ownership cycle, including purchase, power consumption, maintenance, upgrades, and operational efficiency. The best long-term choice is a manufacturer that can scale with changing workloads, support evolving AI frameworks, protect sensitive data, and deliver predictable value throughout the server’s service life.